Sandeep Dhakal’s Jupyter notebooks
Categories
All
(6)
DEM
(1)
GIS
(4)
PostGIS
(1)
animation
(1)
earthquakes
(1)
elections
(1)
matplotlib
(1)
sankey
(1)
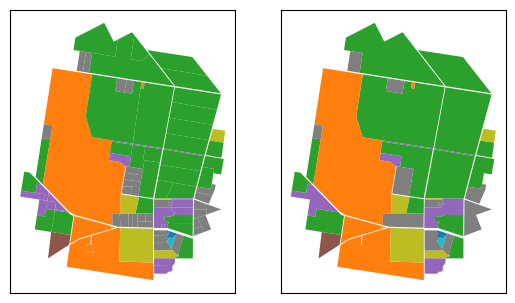
Efficiently dissolving adjacent polygons by attributes in a large GIS database
GIS
PostGIS
Using PostGIS to efficiently dissolve adjacent polygons by attributes in a large-table with >750k rows of data.
May 15, 2025
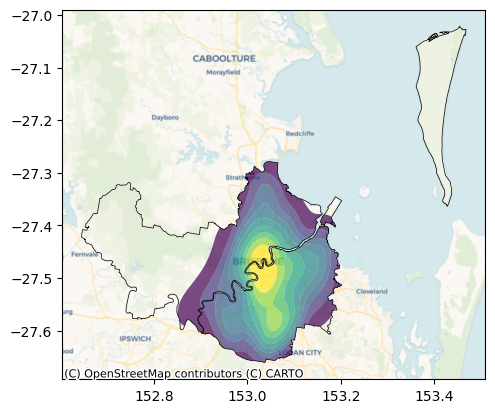
Spatial KDE plots in Python
GIS
I frequently use KDE plots for my work, but I have not previously used them for spatial analysis. I found a really cool example here using the
geoplot
Python library.
geoplot
…
Apr 28, 2025
Animated scatter plot with size legend with matplotlib
animation
matplotlib
I have been looking at generating animated plots using Matplotlib, with the official documentation providing an excellent example for basic animations.
Apr 17, 2025
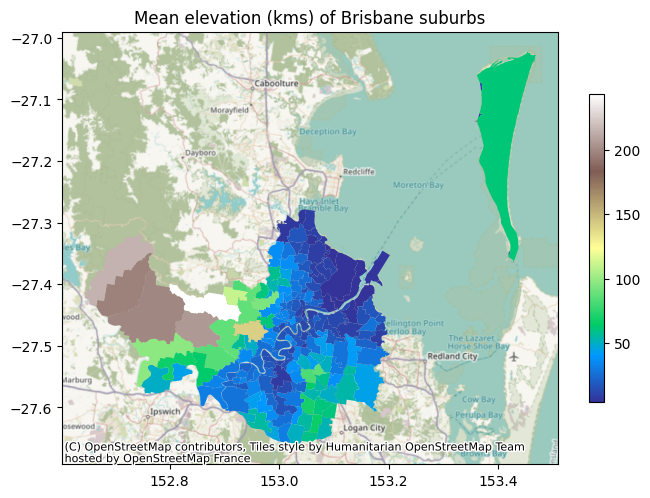
Zonal statistics: mean elevation of brisbane suburbs
GIS
DEM
As part of my geospatial analysis journey and the mapping of various things in Brisbane, in this notebook I will look at the digital elevation data of Brisbane suburbs.
Apr 15, 2025
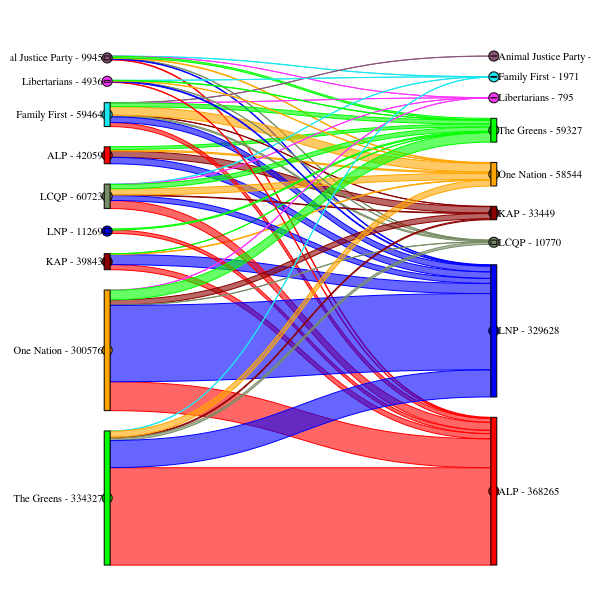
Visualising preference flows in 2024 QLD state elections
sankey
elections
I have recently written a dashboard to explore the preference flows of votes during the 2024 QLD state elections. The dashboard is available here.
Mar 10, 2025
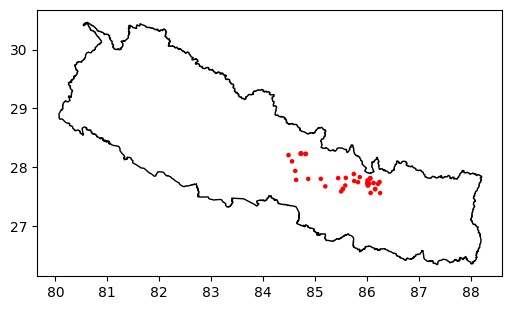
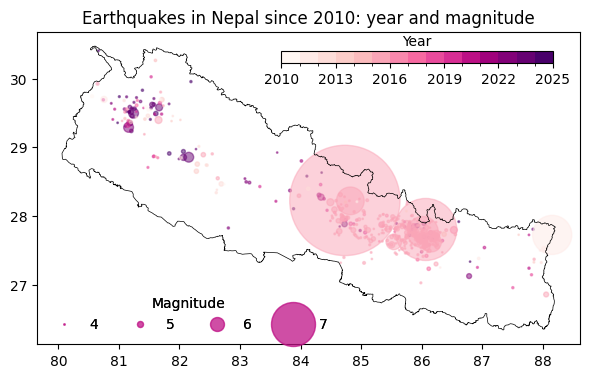
Visualising Earthquakes in Nepal
GIS
earthquakes
In this notebook, we will analyse the earthquakes that occurred in Nepal since 2010.
Oct 15, 2024
No matching items